Page 54 - หนังสือรายงานสำรวจค่าใช้จ่าย
P. 54

47


                      ี
                                                                  ื
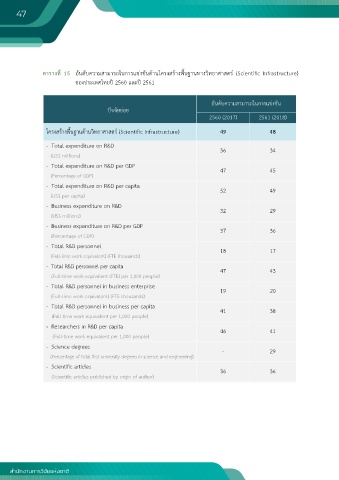
                 ต�ร�งท่ 15  อันดับความสามารถในการแข่งขันด้านโครงสร้างพ้นฐานทางวิทยาศาสตร์ (Scientific Infrastructure)
                              ของประเทศไทยปี 2560 และปี 2561

                                                                           อันดับความสามารถในการแข,งขัน
                                       ปFจจัยย,อย
                                                                           2560 (2017)      2561 (2018)

                 โครงสร/างพืนฐานด/านวิทยาศาสตรT (Scientific Infrastructure)   49                48
                          ้
                 -  Total expenditure on R&D                                  36                34
                   (US$ millions)
                 -  Total expenditure on R&D per GDP                          47                45

                   (Percentage of GDP)
                 -  Total expenditure on R&D per capita                       52                49
                   (US$ per capita)
                 -  Business expenditure on R&D                               32                29
                   (US$ millions)
                 -  Business expenditure on R&D per GDP                       37                36

                   (Percentage of GDP)
                 -  Total R&D personnel
                                                                              18                17
                   (Full-time work equivalent) (FTE thousands)
                 -  Total R&D personnel per capita
                                                                              47                43
                    (Full-time work equivalent (FTE) per 1,000 people)
                 -  Total R&D personnel in business enterprise                19                20
                   (Full-time work equivalent) (FTE thousands)
                 -  Total R&D personnel in business per capita                41                38
                    (Full-time work equivalent per 1,000 people)
                 -  Researchers in R&D per capita                             46                41

                    (Full-time work equivalent per 1,000 people)
                 -  Science degrees
                                                                               -                29
                    (Percentage of total first university degrees in science and engineering)
                 -  Scientific articles
                                                                              36                36
                    (Scientific articles published by origin of author)
                 -  Nobel prizes                                              29                29
                     (Awarded in physics chemistry physiology or medicine and economics since1950)
                 -  Nobel prizes per capita
                    (Awarded in physics chemistry physiology or medicine and economics    29    29
                    since 1950 per million people)

                  - Patent applications                                       52                39
                    (Number of applications filed by applicant’s origin)
                 -  Patent applications per capita                            60                55
                     (Number of applications filed by applicant’s origin, per 100,000 inhabitants)


                                 /
                                  ,
                                                     ั
                                                    ิ
                รายงานการสำรวจค,าใชจายและบุคลากรทางการวจยและพัฒนาของประเทศไทย ประจำปA 2561                    34
   49   50   51   52   53   54   55   56   57   58   59