Page 55 - หนังสือรายงานสำรวจค่าใช้จ่าย
P. 55

อันดับความสามารถในการแข,งขัน
                                       ปFจจัยย,อย
                  โครงสร/างพืนฐานด/านวิทยาศาสตรT (Scientific Infrastructure)
                                                                                                48
                          ้
                                                                               49
                  -  Total expenditure on R&D
                                                                                                34
                                                                               36
                   (US$ millions)
                  -  Total expenditure on R&D per GDP
                                                                               47
                                                                                                45
                   (Percentage of GDP)
                  -  Total expenditure on R&D per capita
                                                                                                49
                                                                               52
                   (US$ per capita)
                  -  Business expenditure on R&D
                                                                                                29
                                                                               32
                   (US$ millions)
                  -  Business expenditure on R&D per GDP
                                                                               37
                                                                                                36
                   (Percentage of GDP)
                  -  Total R&D personnel
                                                                               18
                                                                                                17
                   (Full-time work equivalent) (FTE thousands)
                  -  Total R&D personnel per capita                        2560 (2017)      2561 (2018)        48
                                                                               47
                                                                                                43
                     (Full-time work equivalent (FTE) per 1,000 people)
                 -  Total R&D personnel in business enterprise
                   (Full-time work equivalent) (FTE thousands)                 19               20

                  -  Total R&D personnel in business per capita                41               38
                    (Full-time work equivalent per 1,000 people)
                  -  Researchers in R&D per capita
                    (Full-time work equivalent per 1,000 people)               46               41
                  -  Science degrees                                           -                29
                     (Percentage of total first university degrees in science and engineering)   อันดับความสามารถในการแข,งขัน

                  -  Scientific articles   ปFจจัยย,อย                          36               36
                    (Scientific articles published by origin of author)    2560 (2017)      2561 (2018)
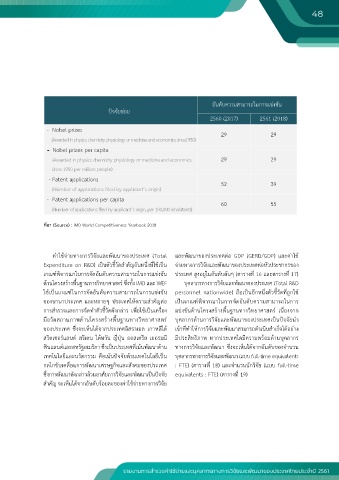
                  -  Nobel prizes                                              49               48
                  โครงสร/างพืนฐานด/านวิทยาศาสตรT (Scientific Infrastructure)
                          ้
                                                                                                29
                                                                               29
                      (Awarded in physics chemistry physiology or medicine and economics since1950)
                  -  Total expenditure on R&D                                  36               34
                  -  Nobel prizes per capita
                   (US$ millions)
                    (Awarded in physics chemistry physiology or medicine and economics    29    29
                  -  Total expenditure on R&D per GDP                          47               45
                    since 1950 per million people)
                   (Percentage of GDP)
                   - Patent applications
                  -  Total expenditure on R&D per capita                       52               39
                    (Number of applications filed by applicant’s origin)
                                                                               52
                                                                                                49
                   (US$ per capita)
                  -  Patent applications per capita
                  -  Business expenditure on R&D                               60               55
                      (Number of applications filed by applicant’s origin, per 100,000 inhabitants)
                                                                               32
                                                                                                29
                   (US$ millions)
                 ี
                ท่ม� (Source) : IMD World Competitiveness Yearbook 2018
                  -  Business expenditure on R&D per GDP
                                                    ิ
                                 /
                รายงานการสำรวจค,าใชจายและบุคลากรทางการวจยและพัฒนาของประเทศไทย ประจำปA           36            34
                                                     ั
                                  ,
                                                                               37 2561
                   (Percentage of GDP)
                  -  Total R&D personnel
                                                                                                17
                                                                               18
                  ค่าใช้จ่ายทางการวิจัยและพัฒนาของประเทศ (Total  และพัฒนาของประเทศต่อ GDP (GERD/GDP) และค่าใช้

                   (Full-time work equivalent) (FTE thousands)
                                                       ี
                                          ี
                                                     ึ
                Expenditure on R&D) เป็นตัวช้วัดสําคัญอันหน่งท่ใช้เป็น  จ่ายทางการวิจัยและพัฒนาของประเทศต่อหัวประชากรของ
                  -  Total R&D personnel per capita
                                                                               47
                                                                                                43
                                                                                                       ี
                                                                                                       ่
                เกณฑ์พิจารณาในการจัดอันดับความสามารถในการแข่งขัน  ประเทศ สูงอยู่ในอันดับต้นๆ (ตารางท 16 และตารางท 17)
                                                                                          ี
                                                                                          ่
                    (Full-time work equivalent (FTE) per 1,000 people)
                                            ์
                         ้
                ดานโครงสรางพื้นฐานทางวิทยาศาสตร ซึ่งทั้ง IMD และ WEF    บุคลากรทางการวิจัยและพัฒนาของประเทศ (Total R&D
                 ้
                  -  Total R&D personnel in business enterprise
                ใช้เป็นเกณฑ์ในการจัดอันดับความสามารถในการแข่งขัน personnel nationwide) ถือเป็นอีกหน่งตัวช้วัดท่ถูกใช้
                                                                                              ึ 20
                                                                                                      ี
                                                                               19
                                                                                                  ี
                   (Full-time work equivalent) (FTE thousands)
                                                                                      ั
                ของนานาประเทศ และหลายๆ ประเทศให้ความสําคัญต่อ  เป็นเกณฑ์พิจารณาในการจัดอนดับความสามารถในการ
                  -  Total R&D personnel in business per capita
                                                 ื
                                                          ื
                                                                                ื
                การสํารวจและการจัดทําตัวช้วัดดังกล่าว เพ่อใช้เป็นเคร่อง  แข่งขันด้านโครงสร้างพ้นฐานทางวิทยาศาสตร์ เน่องจาก
                                                                                                     ื
                                      ี
                                                                                                38
                                                                               41
                    (Full-time work equivalent per 1,000 people)
                มือวัดสถานภาพด้านโครงสร้างพ้นฐานทางวิทยาศาสตร์  บุคลากรด้านการวิจัยและพัฒนาของประเทศเป็นปัจจัยนํา
                                          ื
                  -  Researchers in R&D per capita
                                                                  ี
                                                          ี
                ของประเทศ ซงจะเหนได้จากประเทศอสราเอล เกาหลใต้  เข้าท่ทําให้การวิจัยและพัฒนาสามารถดําเนินสําเร็จได้อย่าง
                                ็
                                              ิ
                            ึ
                            ่
                                                                               46
                                                                                                41
                                                                ี
                                                                    ิ
                                                                      ิ
                                          ี
                                       ั
                                                                                                     ุ
                                                            ี
                               ี
                สวตเซอร์แลนด์ สวเดน ไต้หวน ญ่ปุ่น ออสเตรีย เยอรมน  มประสทธภาพ หากประเทศใดมีความพร้อมด้านบคลากร
                  ิ  (Full-time work equivalent per 1,000 people)
                ฟินแลนด์และสหรฐอเมรกา ซงเป็นประเทศทเน้นพฒนาด้าน  ทางการวิจัยและพัฒนา ซ่งจะเห็นได้จากอันดับของจํานวน
                                      ึ
                                                 ่
                                                 ี
                              ั
                                  ิ
                                      ่
                                                                                  ึ
                                                     ั
                  -  Science degrees
                                                                                                29
                                                                               -
                เทคโนโลยีและนวัตกรรม คือเน้นปัจจัยด้านเทคโนโลยีเป็น  บุคลากรทางการวิจัยและพัฒนา (แบบ full-time equivalents
                     (Percentage of total first university degrees in science and engineering)
                กลไกขับเคล่อนการพัฒนาเศรษฐกิจและสังคมของประเทศ  : FTE) (ตารางท 18) และจํานวนนักวิจัย (แบบ full-time
                          ื
                                                                           ่
                                                                           ี
                  -  Scientific articles
                                                                               36
                                           ิ
                           ั
                      ั
                ซงการพฒนาดงกล่าวล้วนอาศัยการวจยและพฒนาเปนปัจจย  equivalents : FTE) (ตารางท 19)  36
                 ึ
                 ่
                                                      ็
                                                                                     ี
                                                                                     ่
                                                 ั
                                                           ั
                                            ั
                    (Scientific articles published by origin of author)
                สําคัญ จะเห็นได้จากอันดับร้อยละของค่าใช้จ่ายทางการวิจัย
                  -  Nobel prizes                                              29               29
                      (Awarded in physics chemistry physiology or medicine and economics since1950)
                  -  Nobel prizes per capita
                    (Awarded in physics chemistry physiology or medicine and economics    29    29
                    since 1950 per million people)
                   - Patent applications                                       52               39
                    (Number of applications filed by applicant’s origin)
                  -  Patent applications per capita                            60               55
                      (Number of applications filed by applicant’s origin, per 100,000 inhabitants)

                                  ,
                                 /
                                                     ั
                                                    ิ
                รายงานการสำรวจค,าใชจายและบุคลากรทางการวจยและพัฒนาของประเทศไทย ประจำปA 2561                    34
   50   51   52   53   54   55   56   57   58   59   60